source:
http://www.houstonchronicle.com/local/gray-matters/article/Drug-charts-Part-1-9193989.phpThe stats on American drug useThough federal, state, and local law enforcement agencies have waged war on drugs for more than 40 years, few people appear to know the size or actual contours of drug use in this country, and the data play only a small role in public policy, mass media presentations, and popular perception.
But data from the best surveys we have — and the best we are likely to get — are available to anyone with a computer. In 1971, at the urging of a National Commission on Marihuana and Drug Abuse, appointed by President Richard Nixon, the federal government launched the annual National Survey on Drug Use and Health, which involves face-to-face interviews with approximately 70,000 people 12 years and older. Monitoring the Future, begun in 1975, questions approximately 50,000 teens annually, with follow-ups in later years.
Easily qualifying as Big Data, the two surveys provide a rich and revealing picture of drug use in America.
Still, it's one thing for data to be available. And it's another for that data to be presented graphically, in ways that are easy to understand. That's what we intend to do here, over the next few days. Today we'll begin with a basic overview of drug use in America. Then, on following days, we'll move on to the little-seen but important Brian C. Bennett Drug Charts and what they reveal about individual drugs.
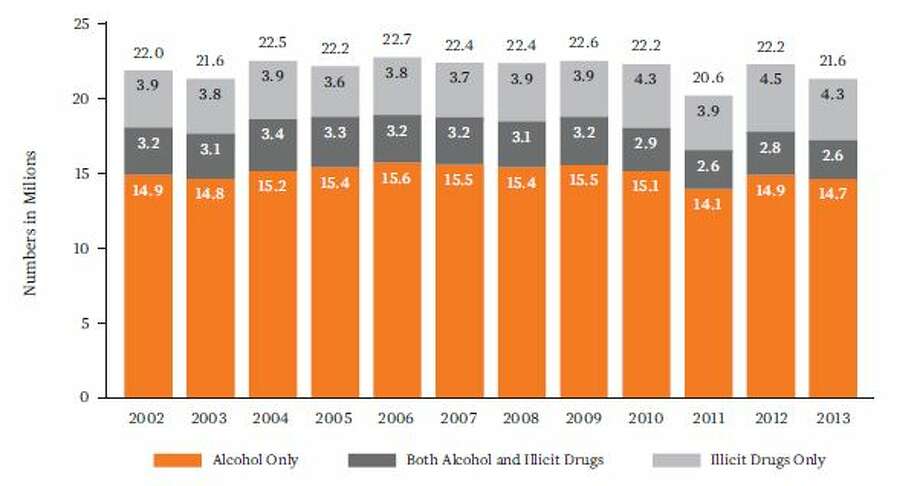
STATISTICALLY SPEAKING, what does American drug use look like? Consider the chart below, drawn from the National Survey on Drug Use and Health findings for 2002 to 2014. It depicts the number of U.S. residents ages 12 or older estimated to have a diagnosable Substance Use Disorder, an umbrella term for repeated patterns of harmful drug use, in the past 12 months. The substances monitored include alcohol, illicit drugs and prescription drugs used for nonmedical purposes.
 Photo: 2013 National Survey On Drug Use And Health, Substance Abuse And Mental Health Services AdministrationSubstance dependence or abuse in the past year among persons aged 12 or older (2002-2013).
Note first the similarity in the columns' height. Although tens of millions of people first used alcohol or illicit drugs during this period, the number of people with problematic use of these substances was remarkably similar each year, averaging slightly more than 22 million people annually despite an influx of new users. The number of people who developed problems with various substances was roughly matched by the number who recovered from them, usually on their own and without treatment.
Secondly, notice the predominance of alcohol abuse in each of these years. On average over these 13 years, 68 percent of Substance Use Disorders involved alcohol only; another 14 percent involved both alcohol and illicit drugs; and 18 percent involved illicit drugs only.
It is important to recognize that alcohol is a drug with risk factors similar to other drugs. In fact, the National Institute on Alcohol Abuse and Alcoholism has labeled alcohol the drug most likely to provoke violent behavior and cause the greatest loss of mental and physical control.
YOU MIGHT wonder: How an usage rates remain stable over time? As the second chart here shows, most people who use any potentially problematic drug don't use it for long after initial experimentation, and even those who use it frequently, even to the point of abuse, are quite likely to reduce their use significantly as they age. Year after year, decade after decade, the pattern repeats itself.
 Past month illicit drug use among persons aged 12 or older, by age (2012 and 2013).
As seen in this chart, according to data from the 2013 and 2014 National Survey on Drug Use and Health, illicit drug use begins as early as age 12 and accelerates sharply, reaching a peak between ages 18 and 20 — the prime years for risky behavior, particularly by young men. Drug use then drops rapidly over the next two decades, influenced by factors such as academic demands, family and career responsibilities, hangovers and awareness that addiction is not a desirable state. While more than half of people in the U.S. use alcohol on a rather frequent basis, the patterns for problematic use follow a similar age-related decline.
These patterns are highly relevant for criminal justice. Most arrests for illicit drugs occur prior to the age of 30, when most offenders are in the midst of a natural process of recovery.
Ill-considered laws and harsh punishments have destroyed the lives of people who need only to get a bit older to become responsible citizens for life. And we have spent $1 trillion in the process.


